
Invoiced sales data lives in your ERP or accounting system, while product usage metrics sit in a product database or data warehouse. Most reps don’t have access or time to dig through complex BI dashboards. The result? They pitch extra licenses to account holders who aren’t even using their current plan — or get surprised by churn risks during the call.
With OneClick, bring live sales history and product usage data straight into Pipedrive where your team prepares.
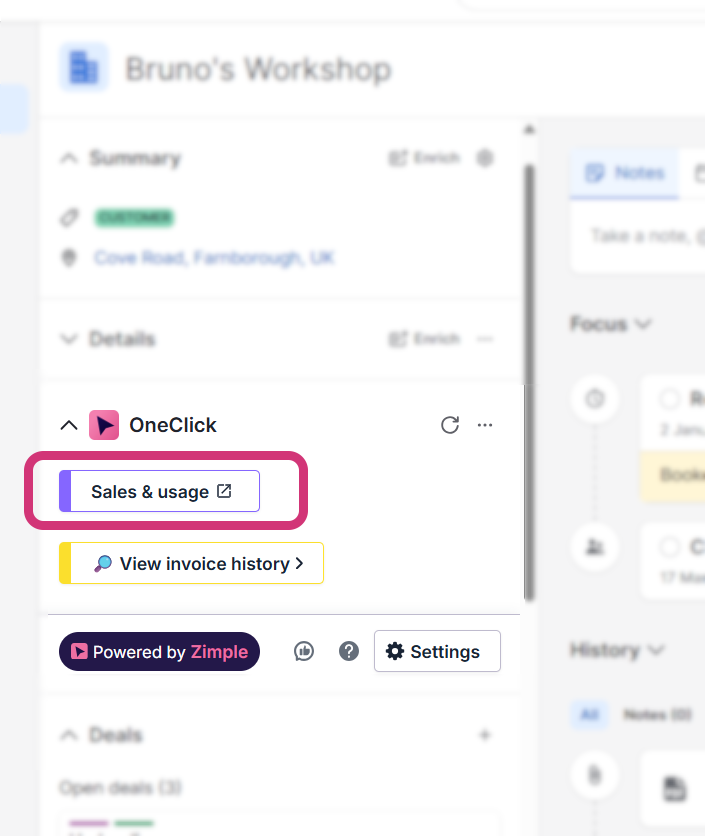
Real-time account intelligence
A single click on a deal or organization opens a clean, multi-tab interface built for sales preparation:
- Account Overview: See YTD sales, recurring monthly revenue, average order value, and open pipeline alongside clear visual charts comparing this year’s trend to last year.
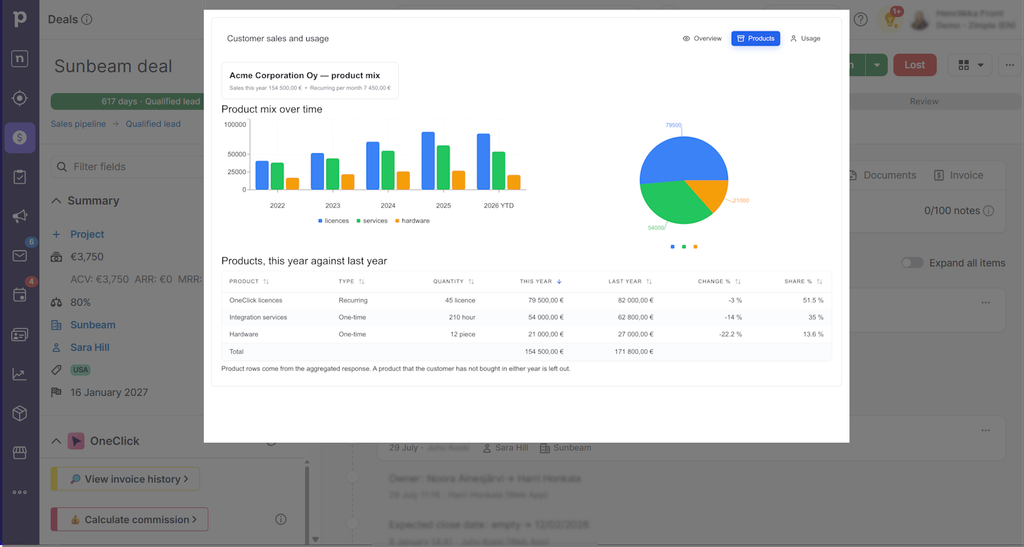
- Product Breakdown: Understand product mix trends (e.g., software licenses vs. hardware vs. services) and spot fast-growing product lines or declining accounts instantly.
- License & Usage Health: Track active users against paid licenses. Spot low-usage warnings (e.g., “Only 40% of API licenses active”) so you can address adoption risks before the customer asks why they are paying for unused seats.
Connected to your existing data stack
Zero code required. Whether your figures live in an ERP, Netvisor, Google BigQuery, or a Power BI dataset, your integration platform (Make, Zapier, n8n) securely aggregates the totals and feeds them straight to Pipedrive. No more logging into seven different systems to get an overall idea of a customer’s behaviour.